Experiment 5
Contents
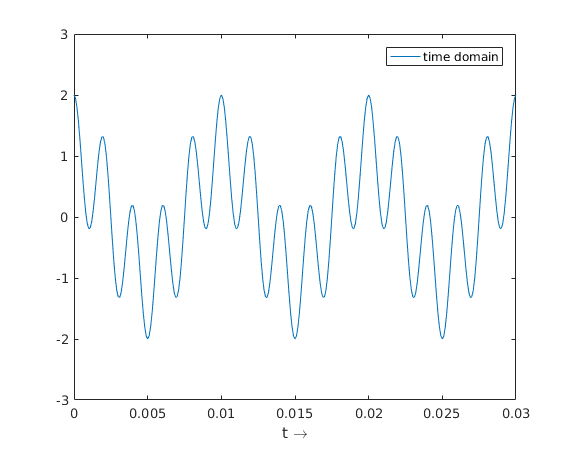
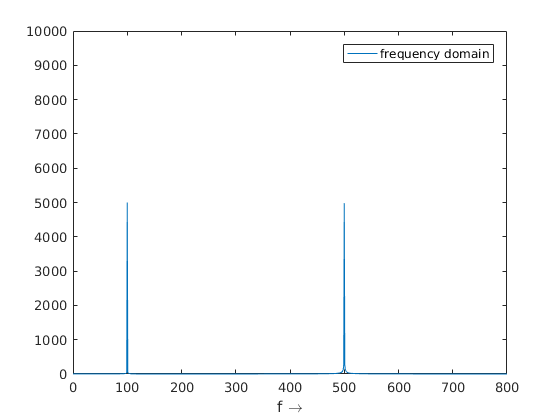
1. (a)
clc;clear;
fs = 10000;
t = 0:1/fs:1;
x = cos(2*pi*100*t) + cos(2*pi*500*t);
y = fft(x);
plot(t,x);
axis([0 0.03 -3 3]);
legend('time domain');
xlabel('t \rightarrow');
figure;
plot(t*fs, abs(y));
axis([0 800 0 10000]);
legend('frequency domain');
xlabel('f \rightarrow');
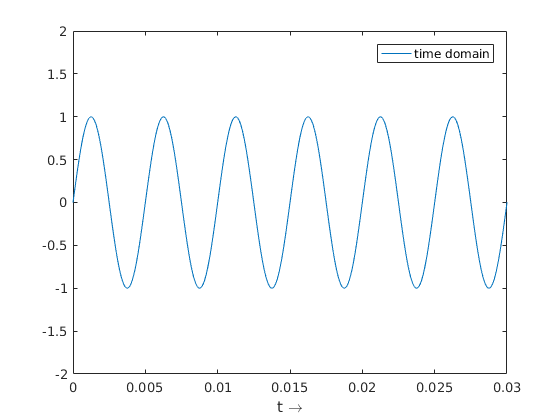
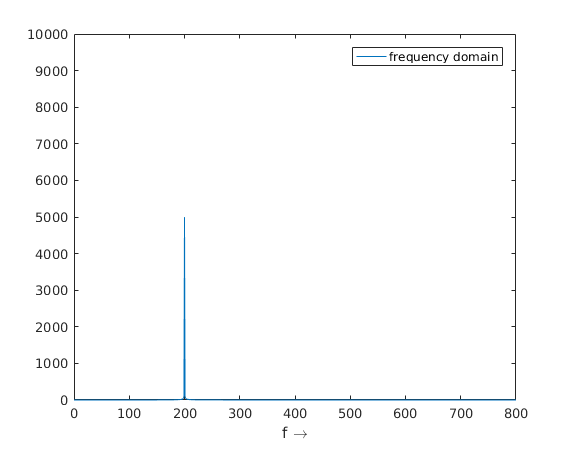
1. (b)
clc;clear;
fs = 10000;
t = 0:1/fs:1;
x = sin(2*pi*200*t);
y = fft(x);
plot(t,x);
axis([0 0.03 -2 2]);
legend('time domain');
xlabel('t \rightarrow');
figure;
plot(t*fs, abs(y));
axis([0 800 0 10000]);
legend('frequency domain');
xlabel('f \rightarrow');
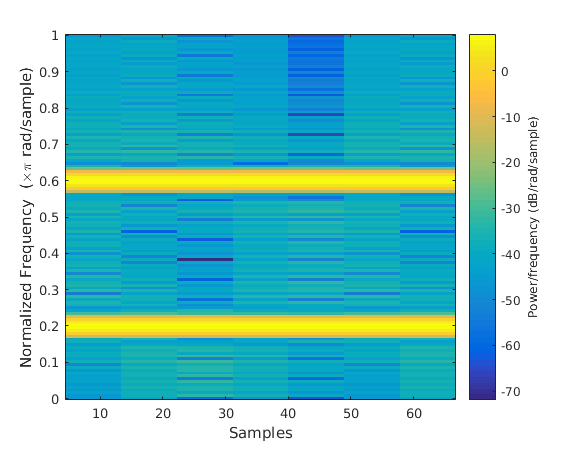
2.
t = 0:0.001:0.5;
x = cos(2*pi*100*t)+sin(2*pi*300*t);
spectrogram(x, 'yaxis');